前言
最近在鼓捣用 python 制作水质分析月报,感觉还是蛮好玩的,对于一些高频的报告还是比较好用的,只要定好思路,做好模板,以后只需要更新数据表,然后运行代码就可以了。
环境准备
安装关键库 python-docx
1
| pip install python-docx -i https://mirrors.aliyun.com/pypi/simple
|
思路
- 导入库和加载数据
在开始之前,我们需要导入所需的库,并加载我们要分析的数据集。这通常包括站点信息和水质监测数据。
- 数据预处理
- 将日期列转换为
datetime 类型以方便时间筛选。
- 根据给定的月份筛选出当月的数据。
- 合并来自不同来源的数据(如站点信息和水质数据)。
- 统计分析
- 计算各项水质指标的统计数据。
- 比较当前月份与去年同期的数据变化。
- 分析水质等级分布情况。
- 图表生成
- 使用
matplotlib 生成饼图、柱状图和折线图等,直观展示水质状况和趋势。
- 保存生成的图表到本地文件系统,以便后续插入到 Word 文档中。
- 文档创建与编辑
- 创建一个新的 Word 文档或打开现有的模板。
- 添加标题、段落、表格和图片到文档中。
- 设置文本样式和对齐方式,确保文档的专业性和可读性。
- 保存最终的 Word 文档。
示例代码解析
以下简化版代码片段。
1
2
3
4
5
6
7
8
9
10
11
12
13
14
15
16
17
18
19
20
21
22
23
24
25
26
27
28
29
30
31
32
33
34
35
36
37
38
39
40
41
42
43
44
45
46
47
48
49
50
51
52
53
54
55
56
57
| from docx import Document
from docx.shared import Pt, Inches
import pandas as pd
import matplotlib.pyplot as plt
site_df = pd.read_excel('datas/site_info.xlsx')
water_quality_df = pd.read_excel('datas/Water_quality_monitoring_data.xlsx')
Month = '2024-06'
def get_monthly_data(month, df):
df['监测时间'] = pd.to_datetime(df['监测时间'])
return df[df['监测时间'].dt.strftime('%Y-%m') == month]
def calculate_water_quality_stats(df):
pass
def create_pie_chart(grade_counts, save_path='water_quality_pie.png'):
plt.figure(figsize=(12, 6))
plt.pie(grade_counts, labels=grade_counts.index, autopct='%1.1f%%')
plt.savefig(save_path)
plt.close()
def add_table_to_doc(df, document):
table = document.add_table(rows=1, cols=len(df.columns))
for j, column in enumerate(df.columns):
table.cell(0, j).text = str(column)
for i, row in df.iterrows():
row_cells = table.add_row().cells
for j, value in enumerate(row):
row_cells[j].text = str(value)
def main():
document = Document()
monthly_data = get_monthly_data(Month, water_quality_df)
merged_data = pd.merge(monthly_data, site_df, on='断面名称', how='left')
document.add_heading(f'{Month}水质月报', level=1)
add_table_to_doc(merged_data, document)
result_text, grade_counts = calculate_water_quality_stats(merged_data)
document.add_paragraph(result_text)
create_pie_chart(grade_counts)
document.add_picture('water_quality_pie.png', width=Inches(6))
document.save(f'{Month}_monthly_report.docx')
if __name__ == '__main__':
main()
|
按照上面的步骤基本就能够做出一个月报了,尝试了一段时间发现并没有 word 、excel 直接编辑方便,好处就是对于一些固定格式的文档可以节约很多精力。
用了 python-docx 后发现,还有一个包也很强大-docxtpl,充分结合了 word 、excel 和 python 的优势,可以批量制作文档,docxtpl 也是基于 python-docx 的,只能说对于重复报告,更加擅长吧。
后面有应用场景的话,我也会边用边记录一下。
效果预览
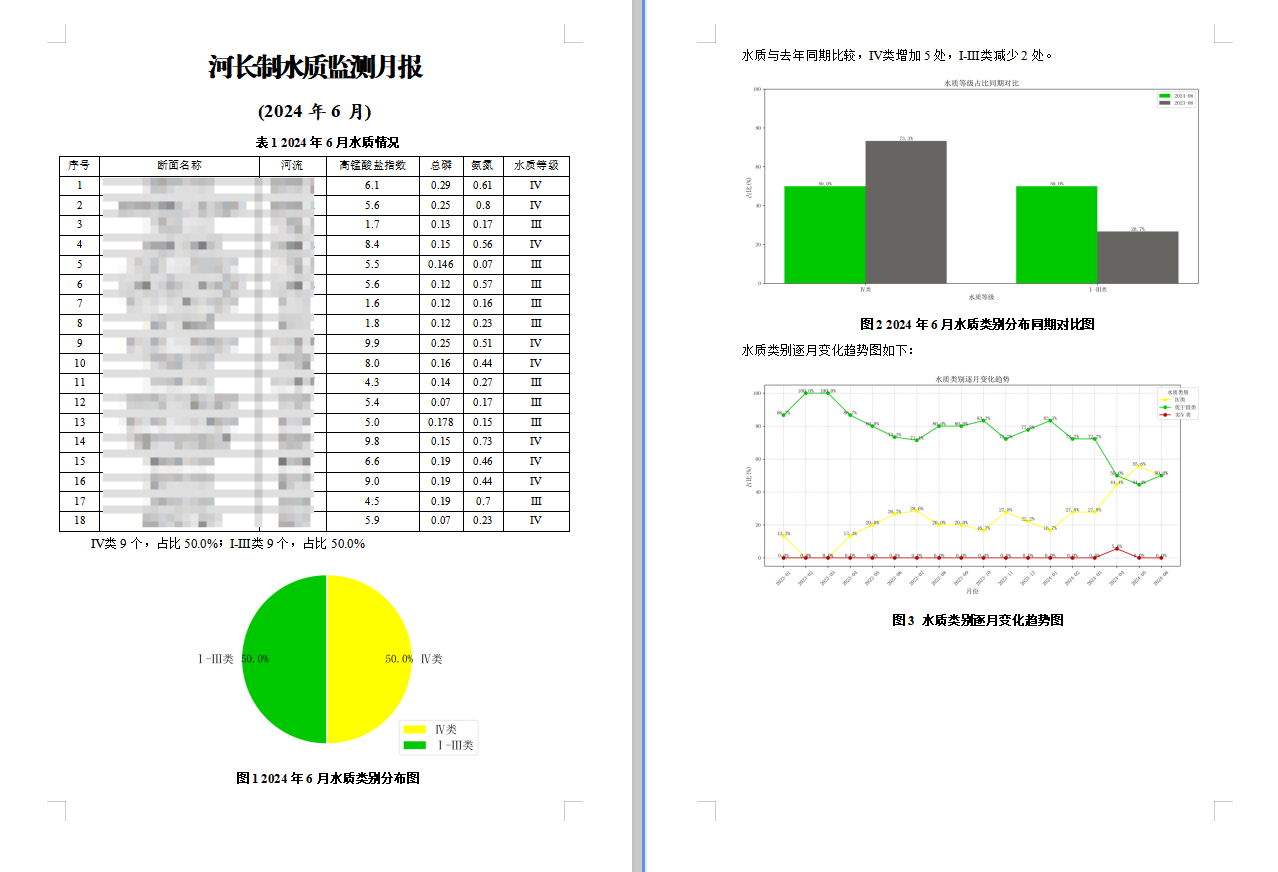
从预览效果也可看出,还是非常简陋的,只进行了,简单的表格、图片、文字插入,还有很多可以丰富的,只是 python 可以将画图、计算自动化,也是非常节约时间了。
常用语法
创建一个新的 Word 文档
1
2
3
4
5
6
| from docx import Document
document = Document()
document = Document('datas/Monthly_report_template.docx')
|
插入段落
1
2
3
4
5
|
paragraph = document.add_paragraph('这是一个新的段落。')
new_paragraph = paragraph.insert_paragraph_before('这是插入的新段落。')
|
修改段落样式
1
2
3
4
5
6
7
8
9
10
11
12
13
14
| from docx.shared import Pt
from docx.enum.text import WD_PARAGRAPH_ALIGNMENT
paragraph.alignment = WD_PARAGRAPH_ALIGNMENT.CENTER
paragraph.style = 'Heading 1'
run = paragraph.add_run('这是加粗并改变字体大小的文本。')
run.bold = True
run.italic = True
run.underline = True
run.font.size = Pt(20)
run.font.name = 'Arial'
|
插入表格
1
2
3
4
5
6
7
8
9
10
|
table = document.add_table(rows=3, cols=4)
table.style = 'Table Grid'
for i in range(3):
for j in range(4):
table.cell(i, j).text = f'Row {i+1}, Col {j+1}'
|
插入图片
1
2
3
4
| from docx.shared import Inches
document.add_picture('example.png', width=Inches(6))
|
添加页眉和页脚
1
2
3
4
5
6
7
8
9
10
|
section = document.sections[0]
5header = section.header
6header_paragraph = header.add_paragraph('这是页眉文本。')
footer = section.footer
footer_paragraph = footer.add_paragraph('这是页脚文本。')
|
添加分页符
1
2
| # 添加分页符
document.add_page_break()
|
添加标题
1
2
3
4
|
document.add_heading('一级标题', level=1)
document.add_heading('二级标题', level=2)
document.add_heading('三级标题', level=3)
|
添加编号或项目符号列表
1
2
3
4
5
6
7
8
9
|
for i in range(3):
paragraph = document.add_paragraph(f'编号项 {i + 1}')
paragraph.style = 'List Number'
for i in range(3):
paragraph = document.add_paragraph(f'项目符号项 {i + 1}')
paragraph.style = 'List Bullet'
|
保存文档
1
2
|
document.save('output.docx')
|
表格样式
Style 非必选,默认有比较多的样式类型。普通网格表就用 Table Grid。
1
| table = document.add_table(rows, cols,style='Table Grid')
|
Style 样式默认值
1
2
3
4
5
6
7
8
9
10
11
12
13
14
15
16
17
18
19
20
21
22
23
24
25
26
27
28
29
30
31
32
33
34
35
36
37
38
39
40
41
42
43
44
45
46
47
48
49
50
51
52
53
54
55
56
57
58
59
60
61
62
63
64
65
66
67
68
69
70
71
72
73
74
75
76
77
78
79
80
81
82
83
84
85
86
87
88
89
90
91
92
93
94
95
96
97
98
99
100
| Normal Table
Table Grid
Light Shading
Liqht Shading Accent 1
Light Shading Accent 2
Light Shading Accent 3
Light Shading Accent 4
Light Shading Accent 5
Light Shading Accent 6
Light List
Light List Accent 1
Light Grid Accent 6
Medium Shading 1
Medium Shading 1 Accent 1
Medium Shading 1 Accent 2
Medium Shading 1 Accent 3
Medium Shading 1 Accent 4
Medium Shading 1 Accent 5
Medium Shading 1 Accent 6
Medium Shading 2
Medium Shading 2 Accent 1
Medium Shading 2 Accent 2
Medium Shading 2 Accent 3
Medium Shading 2 Accent 4
Medium Shading 2 Accent 5
Medium Shading 2 Accent 6
Medium List 1
Medium List 1 Accent 1
Medium List1 Accent 2
Medium List 1 Accent 3
Medium List 1 Accent 4
Medium List 1 Accent 5
Medium List 1 Accent 6
Medium List 2
Medium List 2 Accent 1
Medium List 2 Accent 2
Medium List 2 Accent 3
Medium List 2 Accent 4
Medium List 2 Accent 5
Medium List 2 Accent 6
Medium Grid 1
Colorful Shading Accent 3
ColorfulShading Accent 4
ColorfulShading Accent 5
Colorful Shading Accent 6
Colorful List
Colorful List Accent 1
Colorful List Accent 2
Colorful List Accent 3
Colorful List Accent 4
Light List Accent 2
Light List Accent 3
Light List Accent 4
Light List Accent 5
Light List Accent 6
Light Grid
Light Grid Accent 1
Light Grid Accent 2
Light Grid Accent 3
Light Grid Accent 4
Light Grid Accent 5
Medium Grid 1 Accent 1
Medium Grid 1 Accent 2
Medium Grid 1 Accent 3
Medium Grid 1 Accent 4
Medium Grid 1 Accent 5
Medium Grid 1 Accent 6
Medium Grid 2
Medium Grid 2 Accent 1
Medium Grid 2 Accent 2
Medium Grid 2 Accent 3
Medium Grid 2 Accent 4
Medium Grid 2 Accent 5
Medium Grid 2 Accent 6
Medium Grid 3
Medium Grid 3 Accent 1
Medium Grid 3 Accent 2
Medium Grid 3 Accent 3
Medium Grid 3 Accent 4
Medium Grid 3 Accent 5
Medium Grid 3 Accent 6
Dark List
Dark List Accent 1
Dark List Accent 2
Dark List Accent 3
Dark List Accent 4
Dight List Accent
Dark List Accent 6
Colorful Shading
Colorful Shading Accent 1
Colorful Shading Accent 2
Colorful List Accent 5
Colorful List Accent 6
Colorful Grid
Colorful Grid Accent 1
Colorful Grid Accent 2
Colorful Grid Accent 3
Colorful Grid Accent 4
Colorful Grid Accent 5
Colorful Grid Accent 6
|
参考文件
https://blog.pangao.vip/python-docx%E5%A4%84%E7%90%86word%E6%96%87%E6%A1%A3/
https://pydocx.readthedocs.io/en/latest/enumerated_list_detection.html
BY
纯个人经验,如有帮助,请收藏点赞,如需转载,请注明出处。
微信公众号:环境猫 er
CSDN : 细节处有神明
个人博客: https://maoyu92.github.io/